

Photo Credit: heychli / Shutterstock
Much about air travel has been less enjoyable in the years since the COVID-19 pandemic. Travelers have been plagued by cancellations, delays, and lower-quality service—and more and more passengers are responding with complaints and even incidents of air rage.
One of the most frustrating experiences for many air travelers is a tarmac delay. These delays occur while a plane is waiting for takeoff or has landed, but passengers are on the plane and unable to get off. Common causes for such delays include inclement weather, mechanical or equipment issues, heavy air traffic, or unavailable gates. Federal regulations permit airlines to hold passengers on a plane during a tarmac delay for up to three hours for domestic flights before allowing them to deplane. This means that each tarmac delay can lead to more headaches from late arrivals and departures, missed connections, and other travel complications.
Composition of Tarmac Delays by Stage of Operation
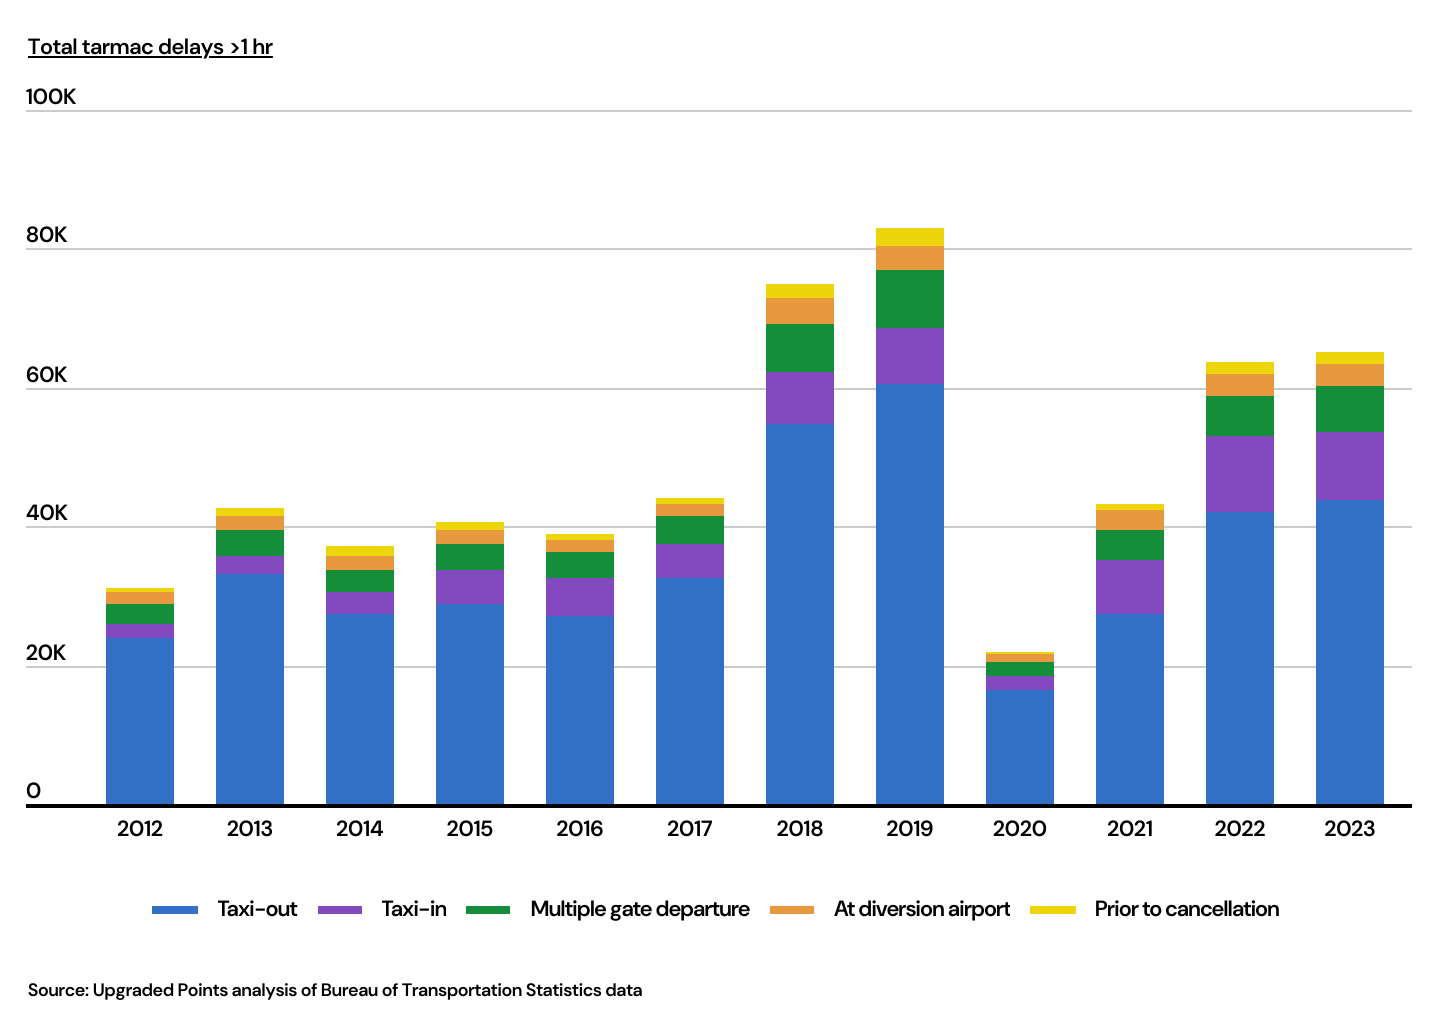
Tarmac delays are approaching pre-pandemic levels after dramatically declining | Image Credit: Upgraded Points
Tarmac delays had been on the rise pre-pandemic, reaching a total of 83,000 in 2019, but plummeted to just 21,849 amid a slowdown in travel during the COVID-19 pandemic in 2020. However, many airlines and airports substantially cut back staffing in response to decreased travel demand during the pandemic and were caught somewhat flat-footed when demand bounced back. Tarmac delays approximately doubled from 2020 to 2021 and increased again by nearly half in 2022. In 2023, delays totaled over 65,000.
Not all tarmac delays are the same, however, and much of the variation in the past few years has been driven by tarmac delays classified as taxi-out—between gate departure and wheels-up—and taxi-in—between wheels down and gate arrival. Other forms of tarmac delays, including multiple gate departures, airport diversions, and cancellations, are more likely to be the result of unexpected weather or mechanical issues and have remained fairly steady over time. Taxi-in and especially taxi-out delays saw much more change before, during, and since the early days of the pandemic.
Below is a complete breakdown of the airlines with the worst tarmac delays. The analysis was conducted by researchers at Upgraded Points using data from the Bureau of Transportation Statistics. For more information on how each statistic was computed, refer to the methodology section below.
U.S. Airlines With the Most Tarmac Delays
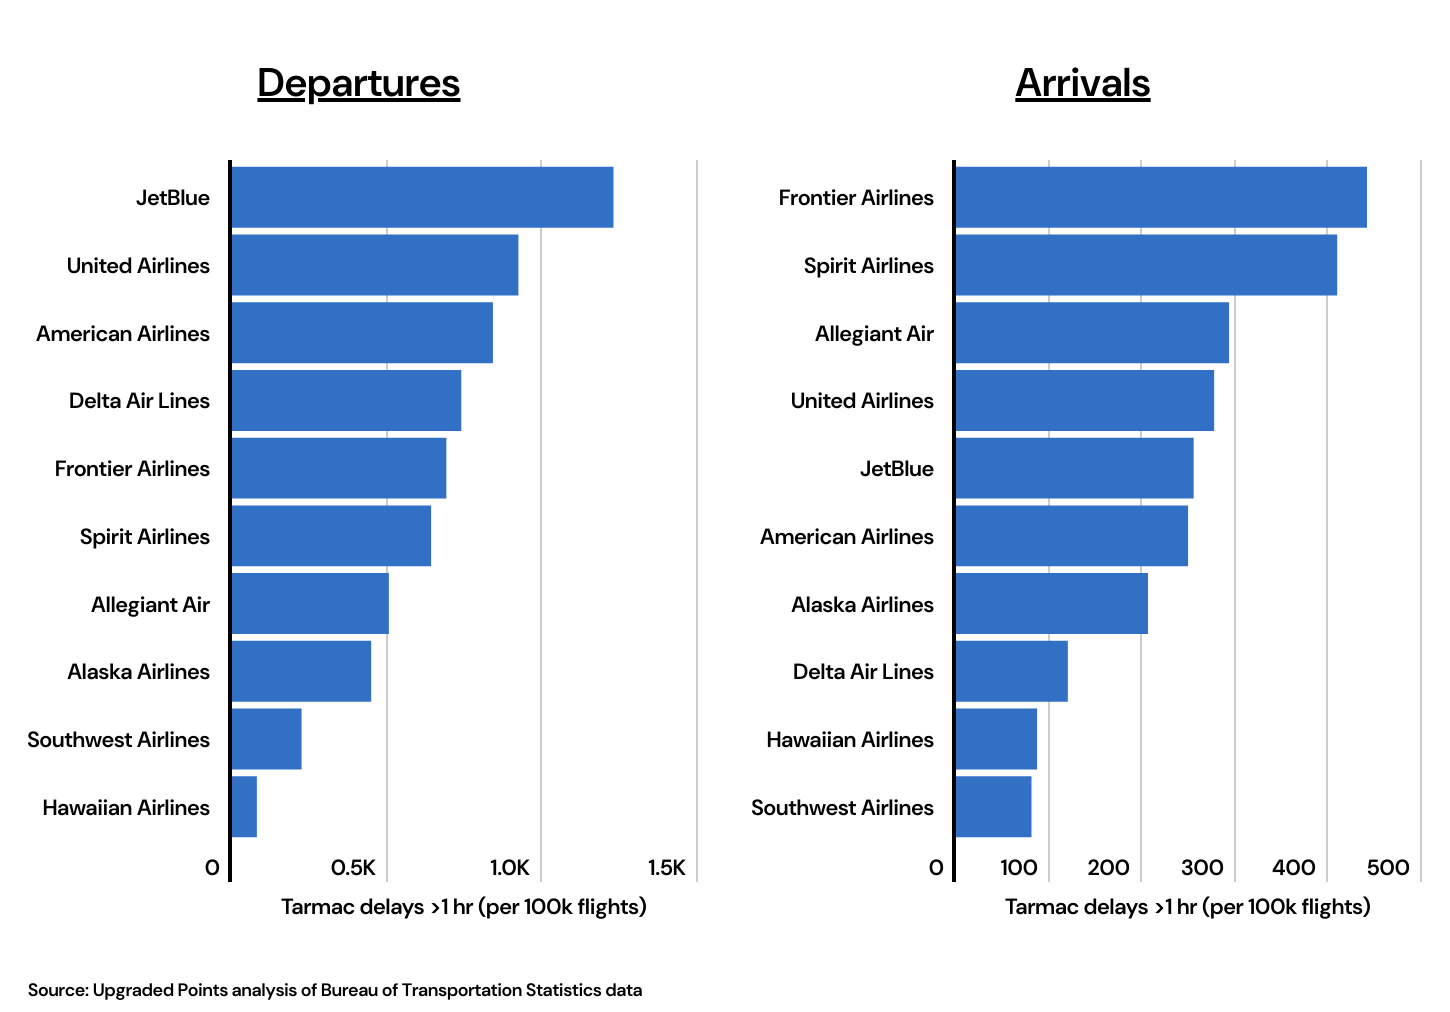
Southwest and Hawaiian Airlines consistently have the lowest frequency of tarmac delays | Image Credit: Upgraded Points
Travelers hoping to avoid tarmac delays may want to evaluate their preferred carriers’ track records. Hawaiian Airlines and Southwest Airlines consistently have the lowest numbers of tarmac delays. Hawaiian has just 80 departure tarmac delays and 87 arrival tarmac delays per 100,000 flights, while Southwest respectively has 224 departure and 81 arrival delays per 100,000 flights. The worst offender for departure delays is JetBlue, which sees 1,228 delays per 100,000 flights, while budget carriers Frontier (441) and Spirit (409) produce the most arrival tarmac delays.
Large Hub Airports With the Most Tarmac Delays
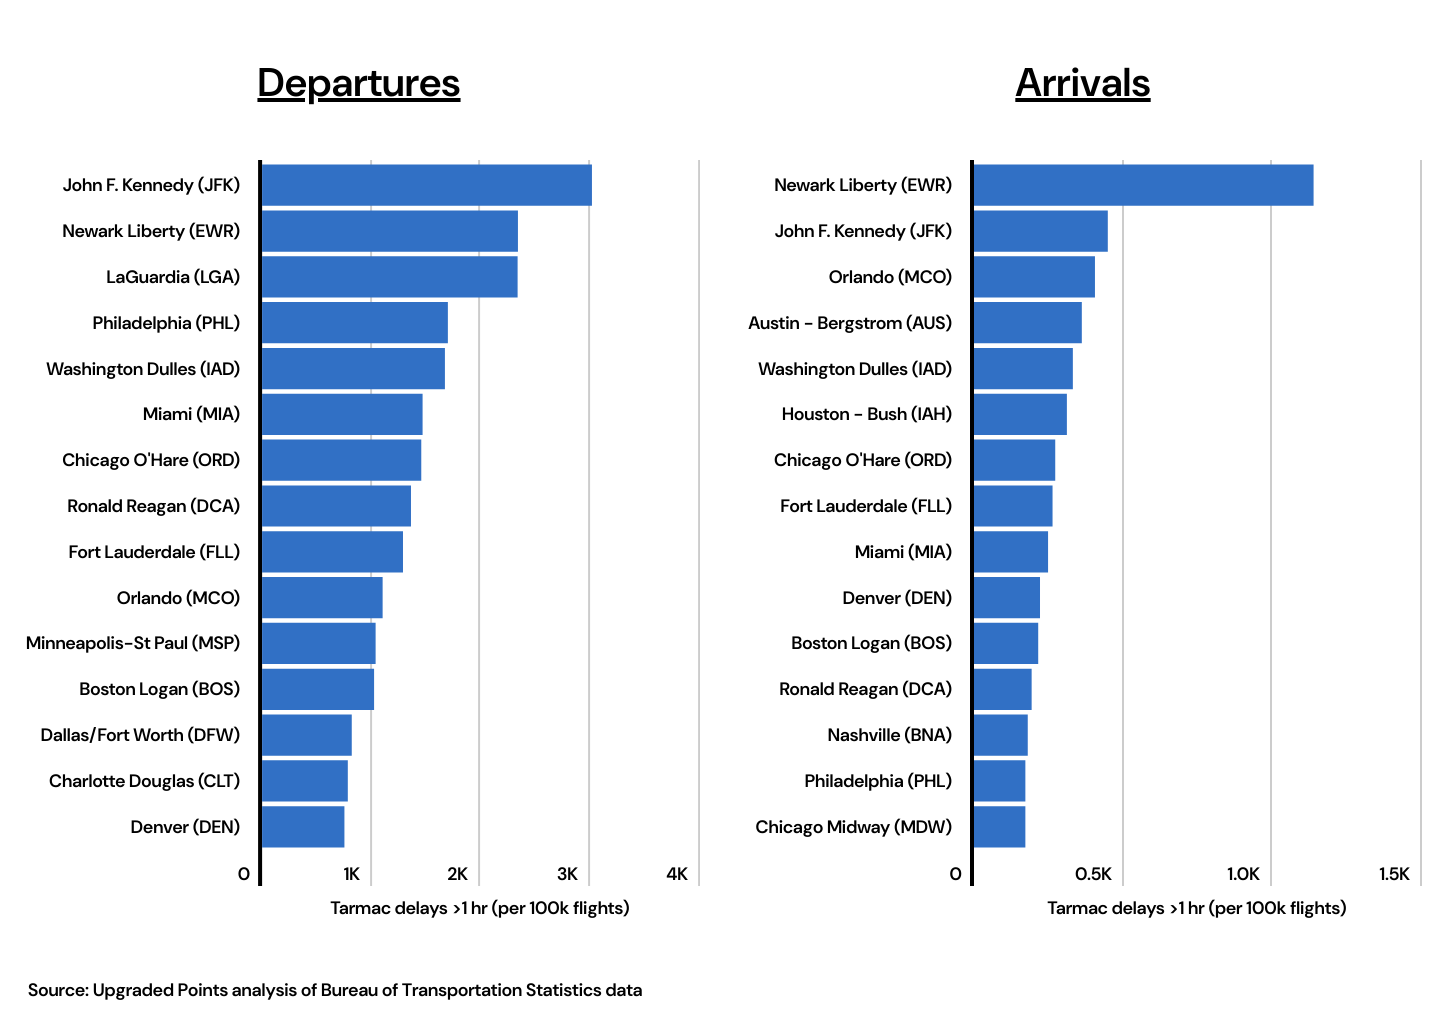
Airports servicing the New York City market have the most tarmac delays | Image Credit: Upgraded Points
Similarly, tarmac delays can vary substantially by airport. Passengers flying through the New York metro are most likely to encounter trouble, as John F. Kennedy (JFK) and Newark Liberty (EWR) lead all major hubs in both departure and arrival tarmac delays, and LaGuardia (LGA) ranks third for departure delays. Additionally, Washington Dulles (IAD) has the 5th most tarmac delays per 100,000 flights and Chicago O’Hare (ORD) ranked 7th.
Medium Hub Airports With the Most Tarmac Delays
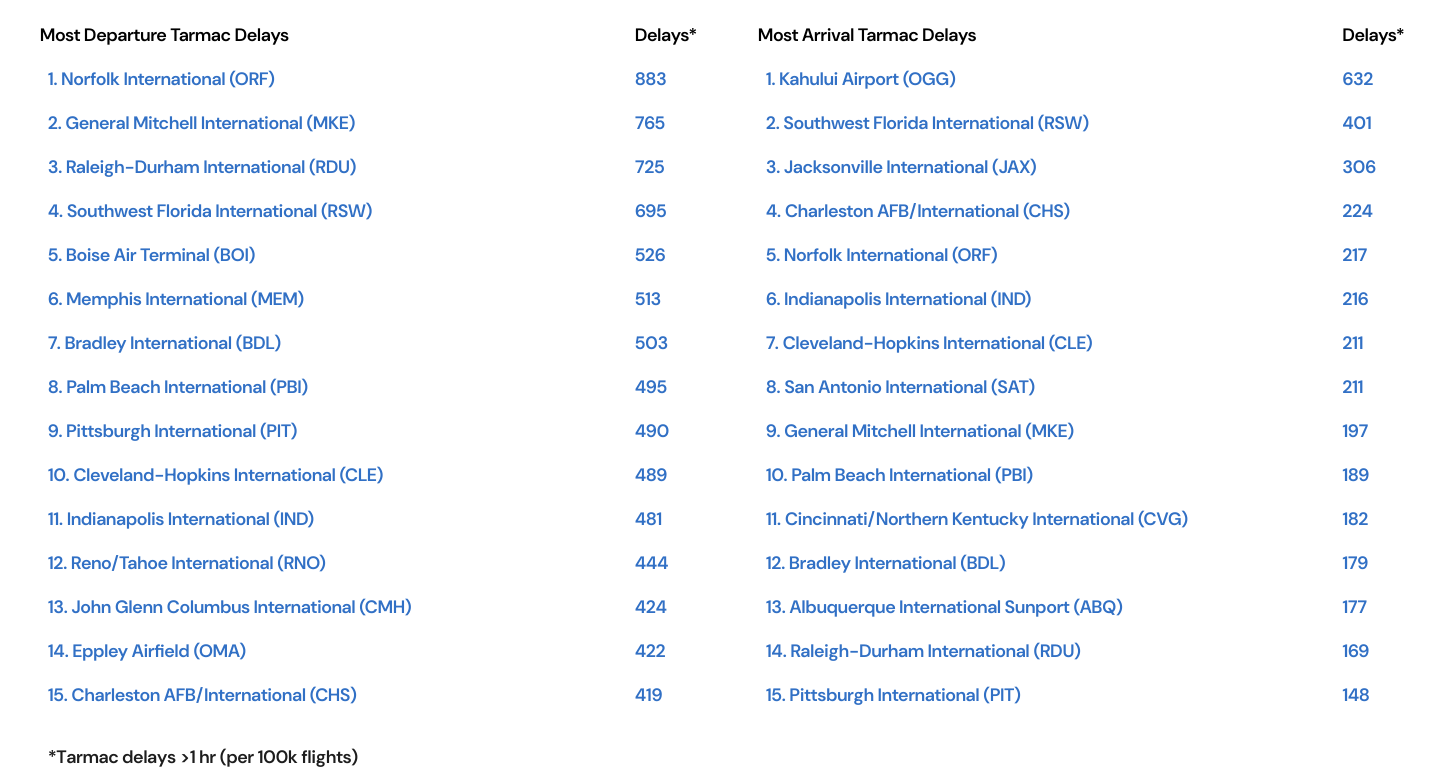
Small Hub Airports With the Most Tarmac Delays
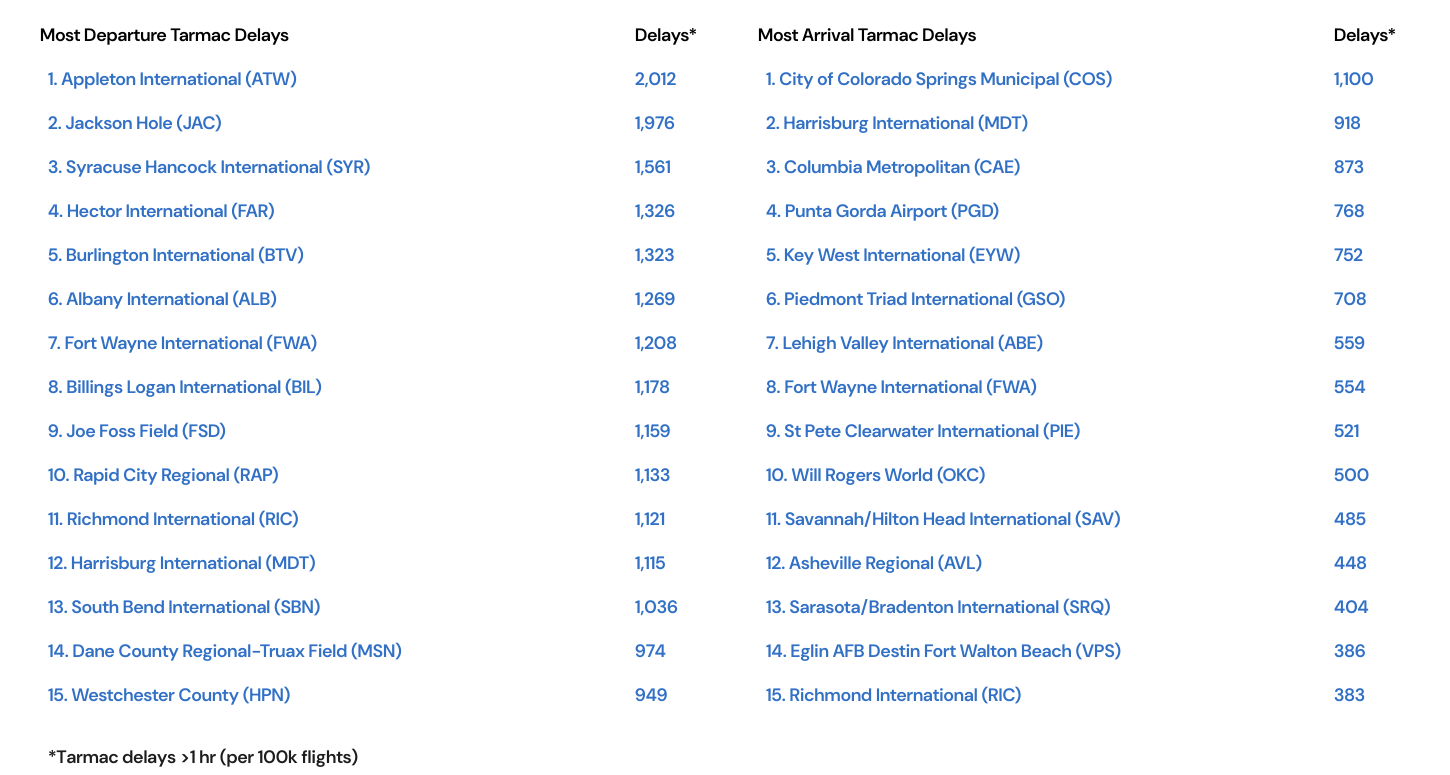
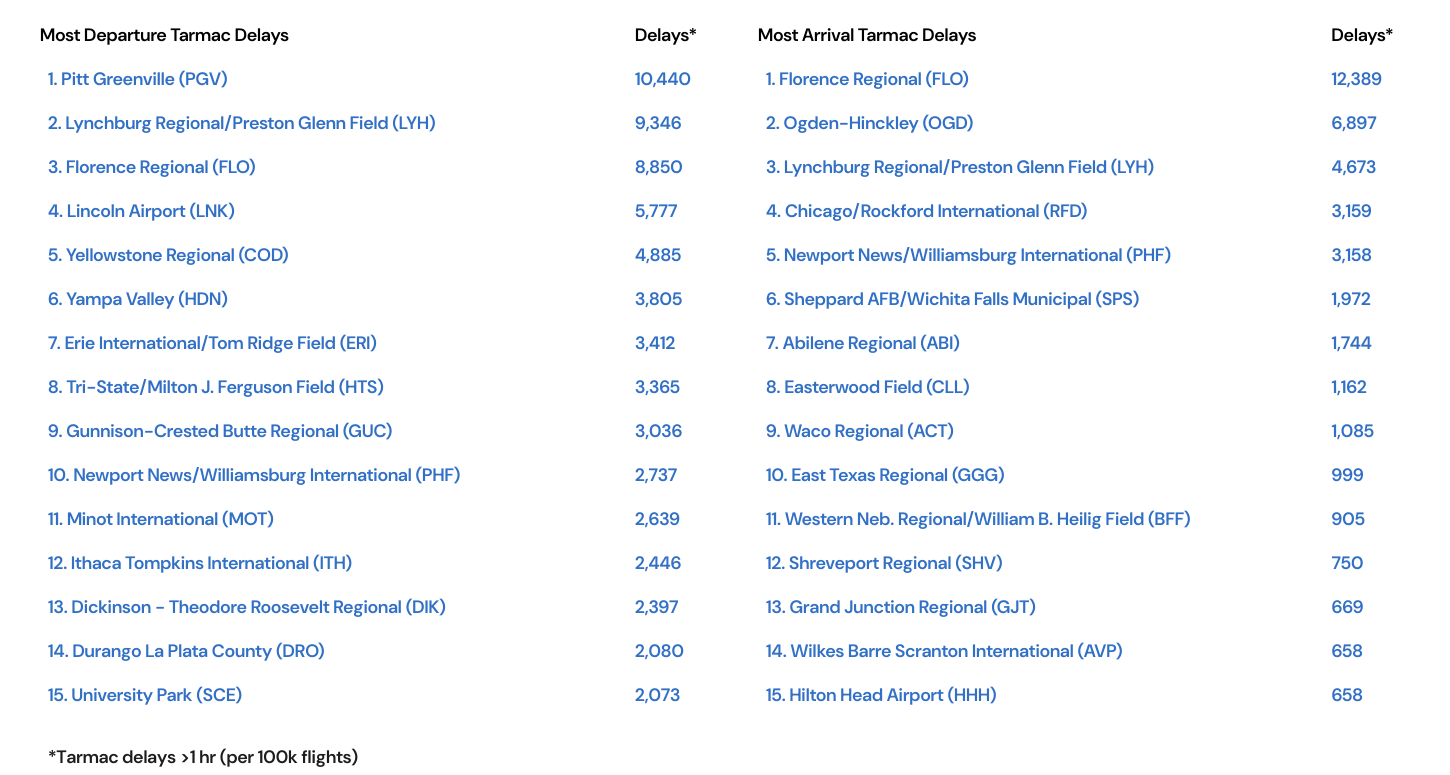
Nonhub Airports With the Most Tarmac Delays
Methodology
Photo Credit: heychli / Shutterstock
To find the U.S. airlines and airports with the worst tarmac delays, researchers at Upgraded Points analyzed the latest data from the Bureau of Transportation Statistics’ Air Travel Consumer Reports. The researchers ranked airlines and airports according to the number of departure tarmac delays lasting longer than an hour (per 100,000 flights). In the event of a tie, the airlines and airports with the larger number of arrival tarmac delays lasting longer than an hour (per 100,000 flights) were ranked higher. For relevance, all available data from 2022 and 2023 were used in the analysis. The researchers also calculated the same statistic for arrival flights and the number of tarmac delays lasting longer than 3 hours (per 100,000 flights) for both departures and arrivals. Tarmac delays categorized as prior to cancellation, multiple gate departure, or taxi-out were considered as occurring during departure, while those categorized as taxi-in or at diversion airport were considered as occurring during arrival.
For complete results, see Airlines and Airports With the Worst Tarmac Delays on Upgraded Points.


