

Photo Credit: Drazen Zigic / Shutterstock
A combination of economic factors, evolving since 2020, has fundamentally reshaped numerous industries and redefined individuals’ relationships with work. Among the most notable outcomes of these transformations is the surge in entrepreneurial activity, including business sales.
Historically low interest rates and high government stimulus provided entrepreneurs and investors with easy access to funding. Transitions to remote and hybrid work and the rise of ecommerce made digitally-based businesses more attractive. Amid the Great Resignation, more workers considered career alternatives including entrepreneurship. While inflation and rising interest rates have somewhat cooled activity in the market more recently, signs point to sustained interest in entrepreneurial activity.
Trends in U.S. Entrepreneurial Activity
Since the beginning of COVID-19, interest in buying and selling businesses has exploded
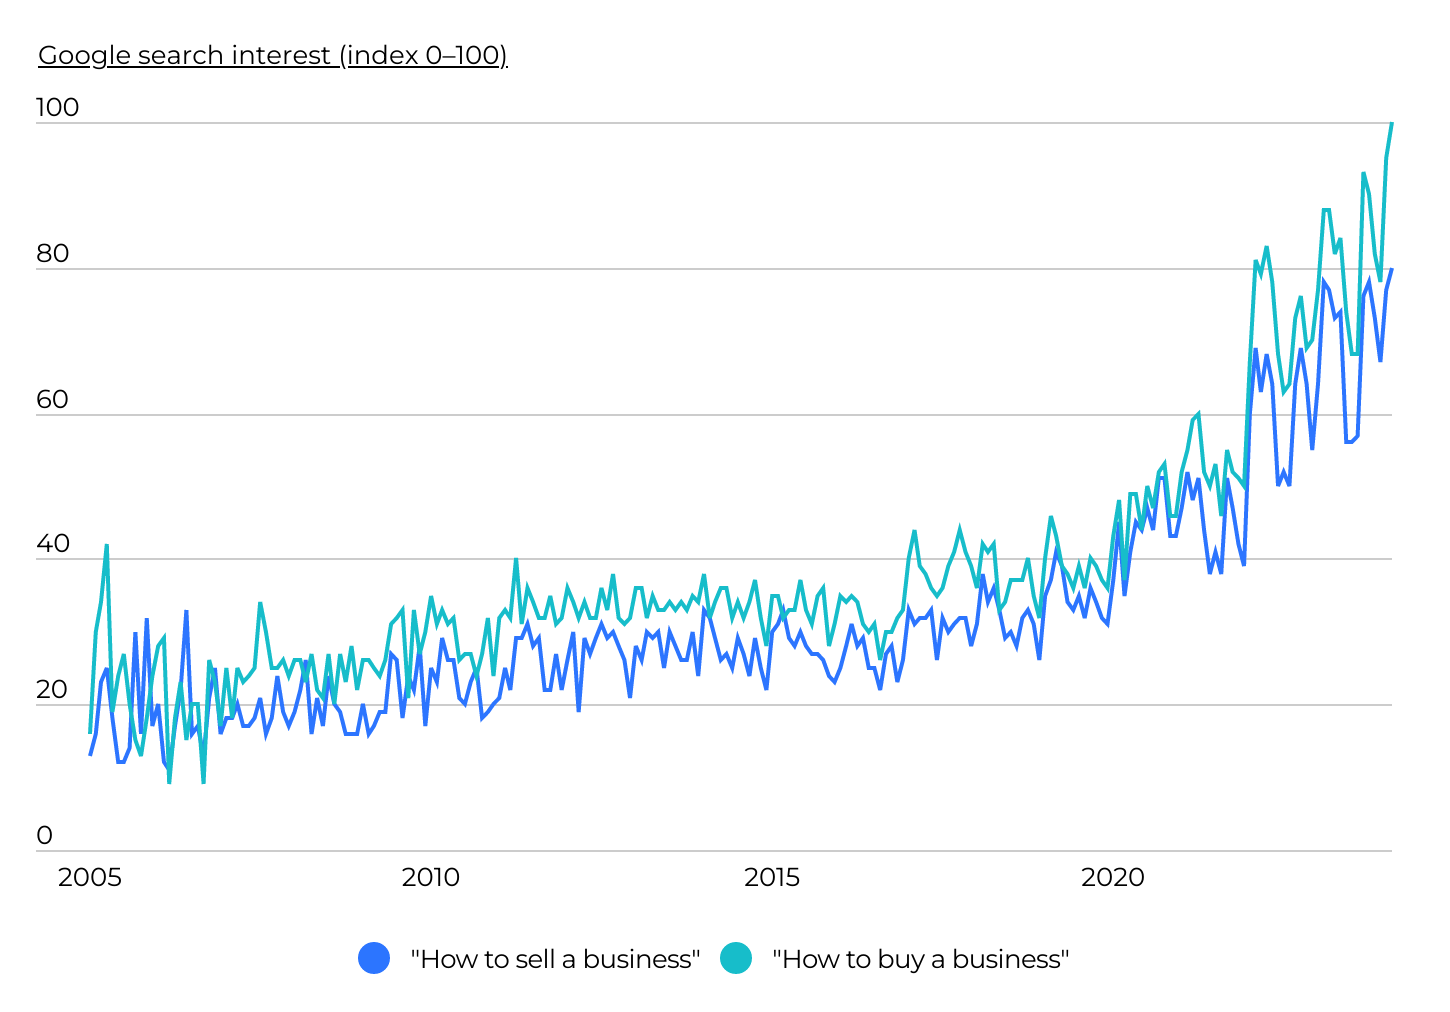
Source: Flippa analysis of Google Trends data (2005–2024) | Image Credit: Flippa
According to data from the U.S. Census Bureau, total new business application volume today is approximately 50% greater than before the pandemic began in early 2020. And entrepreneurs are also considering transactions around existing businesses. Google search data has shown a spike in the search terms “how to sell a business” and “how to buy a business” in recent years. In the Google Trends index, search interest in both terms has risen from the high 30s (out of 100) before COVID to 80+ now, indicating significantly elevated interest.
Total M&A Transaction Volume by State
While California accounts for the most buyer volume, lower-tax states account for a greater proportion of seller volume
Source: Flippa marketplace transactions (2016–2024) | Image Credit: Flippa
In recent years, the rapid pace of digital transformation has generated unparalleled demand for online businesses. While interest in entrepreneurship is up throughout the country, the volume of transactions varies by geography. Notably, residents in California, the epicenter of Silicon Valley, lead the pack of digital asset buyers, followed closely by those in Florida. Each state accounts for approximately 14% of total buyer volume. Other top states for buyers include Texas (8.9%), New York (7.3%), and Illinois (6.1%).
However, the scenario shifts when examining sellers, where California residents do not dominate transaction volumes to the same extent. Instead, residents from states with lower or no tax implications, such as Florida, Texas, and Washington, command a significantly higher share of total seller volume at 15.8%, 14.2%, and 12.8%, respectively.
Per Capita M&A Transaction Volume by State
States in the Mountain West & Florida stand out for high levels of business transactions
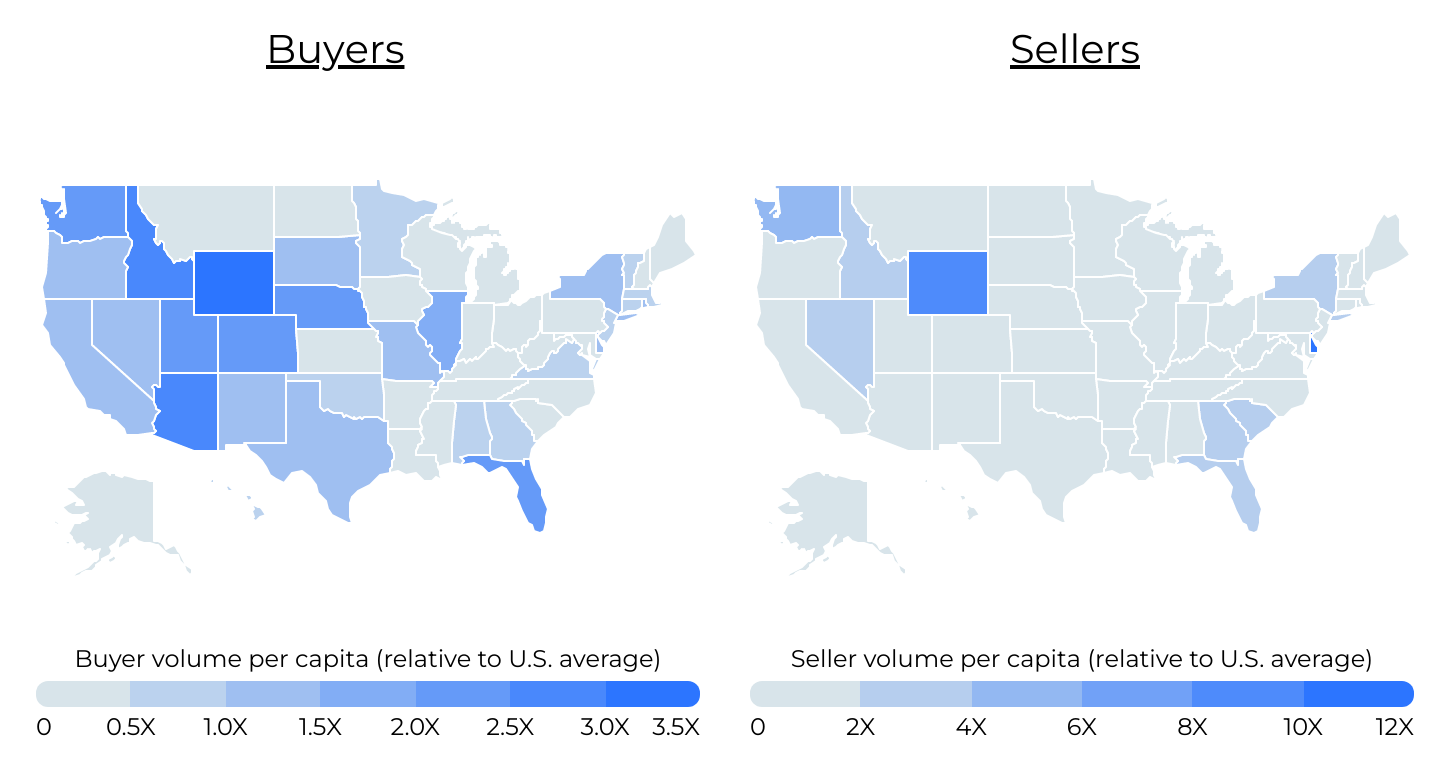
Source: Flippa marketplace transactions (2016–2024) | Image Credit: Flippa
On a per capita basis, states in the Mountain West and Florida are home to a higher volume of buyers. Wyoming leads all states in buyer volume per capita at 3.38 times higher than the U.S. average, with other western states like Idaho, Arizona, and Washington also having buyer volume more than twice the national rate.
Leading states for sellers include Delaware, where the seller volume per capita is nearly 11 times higher than the U.S. average, and Wyoming, where the volume is almost 10 times higher. Delaware, Wyoming, and other leading states for sellers tend to be popular places to start a business due to business-friendly regulatory and tax structures. For example, Delaware is known for having clear corporate law, good liability and privacy protections, an efficient corporate court system, and certain tax advantages that make it an attractive place to operate. Meanwhile, Wyoming is regularly rated as having one of the best tax climates for businesses due to its lack of corporate and individual income taxes and relatively low sales tax rates.
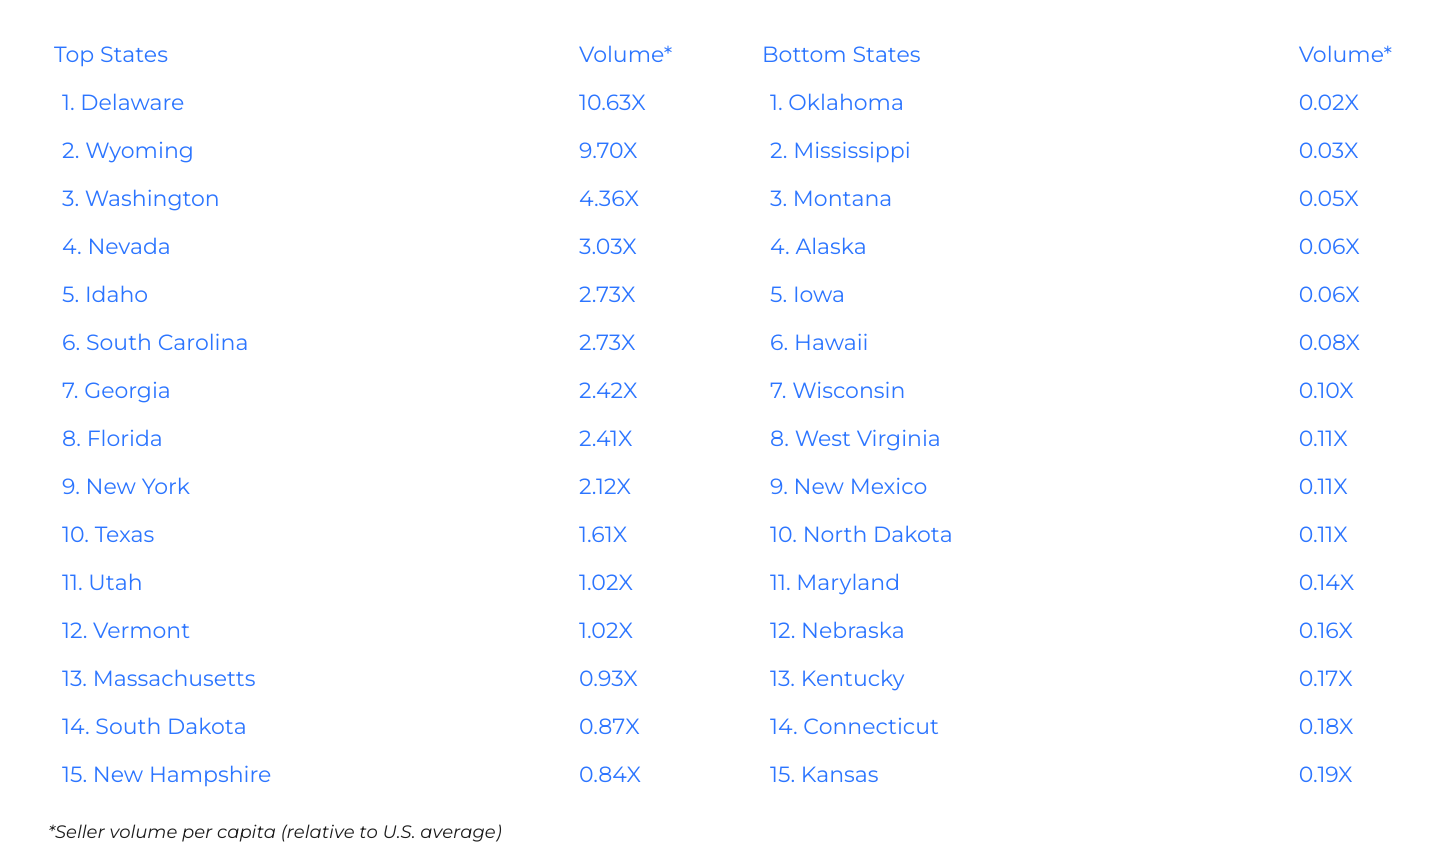
Below is a comparison of per capita business transaction volumes for buyers and sellers in all 50 states. The analysis was conducted by Flippa using over 100,000 business transactions on its marketplace spanning the past eight years. For more information, see the methodology section below.
States With the Most Active Buyers

States With the Most Active Sellers
Methodology

Photo Credit: Drazen Zigic / Shutterstock
The data used in this study is from a proprietary set of more than 125,000 digital asset sales that occurred on the Flippa.com marketplace between 2016 and 2024. To determine the states with the most active tech investors, researchers at Flippa calculated how each state’s total transaction sales volume per capita compared to the U.S. average for both buyers and sellers. The total transaction sales volume was calculated as the sum of the sale prices for all transactions. States were ordered by the per capita buyer transaction volume.
For complete results, see States With the Most Active Tech Investors on Flippa.


